
Weekly & Monthly KPI Tracking
Go deeper into the numbers. Weekly and monthly trend reports compare each period with the one before, across website traffic, lead handling, team performance and inventory.
Request InformationEvery KPI, against the period before
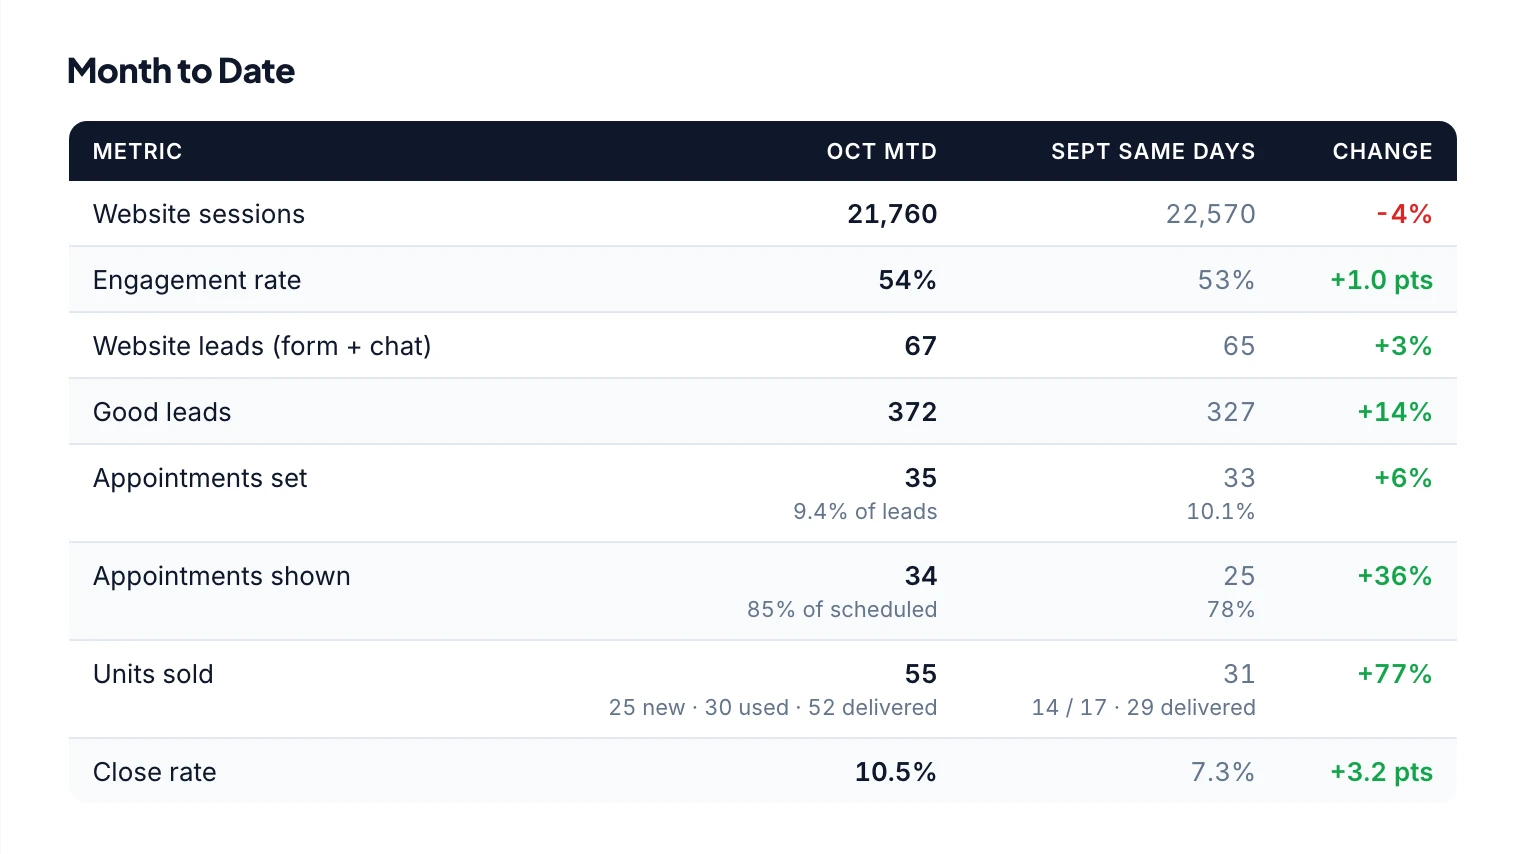
Website sessions, engagement, leads, appointments set and shown, units sold and close rate, week over week and month-to-date against the same days last month.
Website traffic by channel
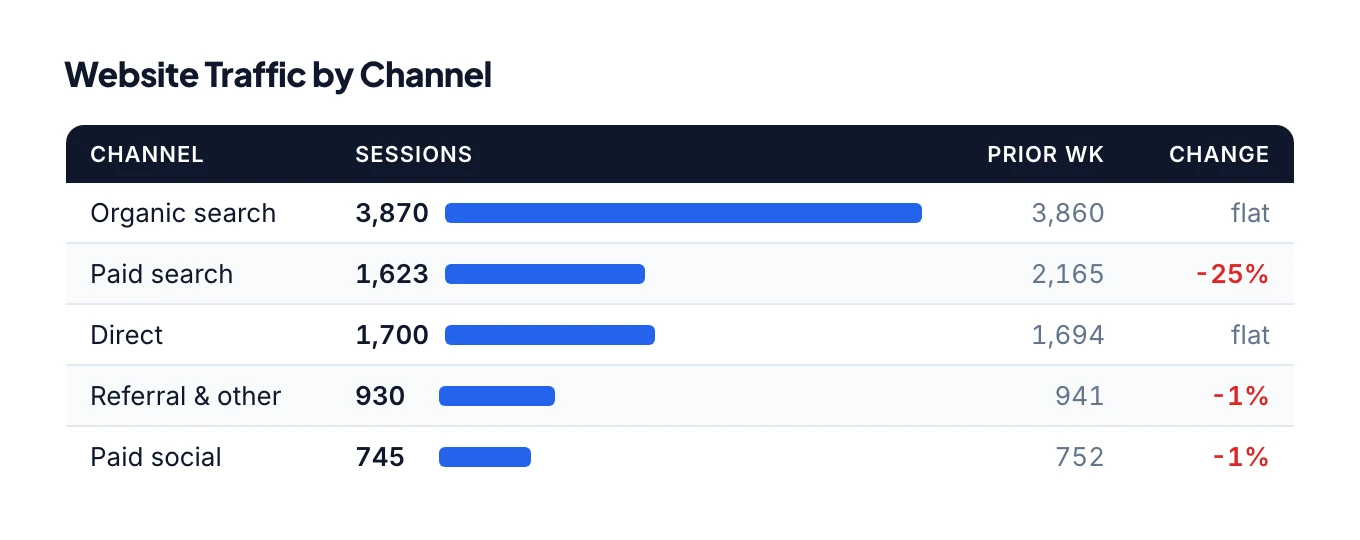
See which channels drove visits and which ones slipped, so a drop in paid search shows up before it shows up in your leads.
Sales team check-in
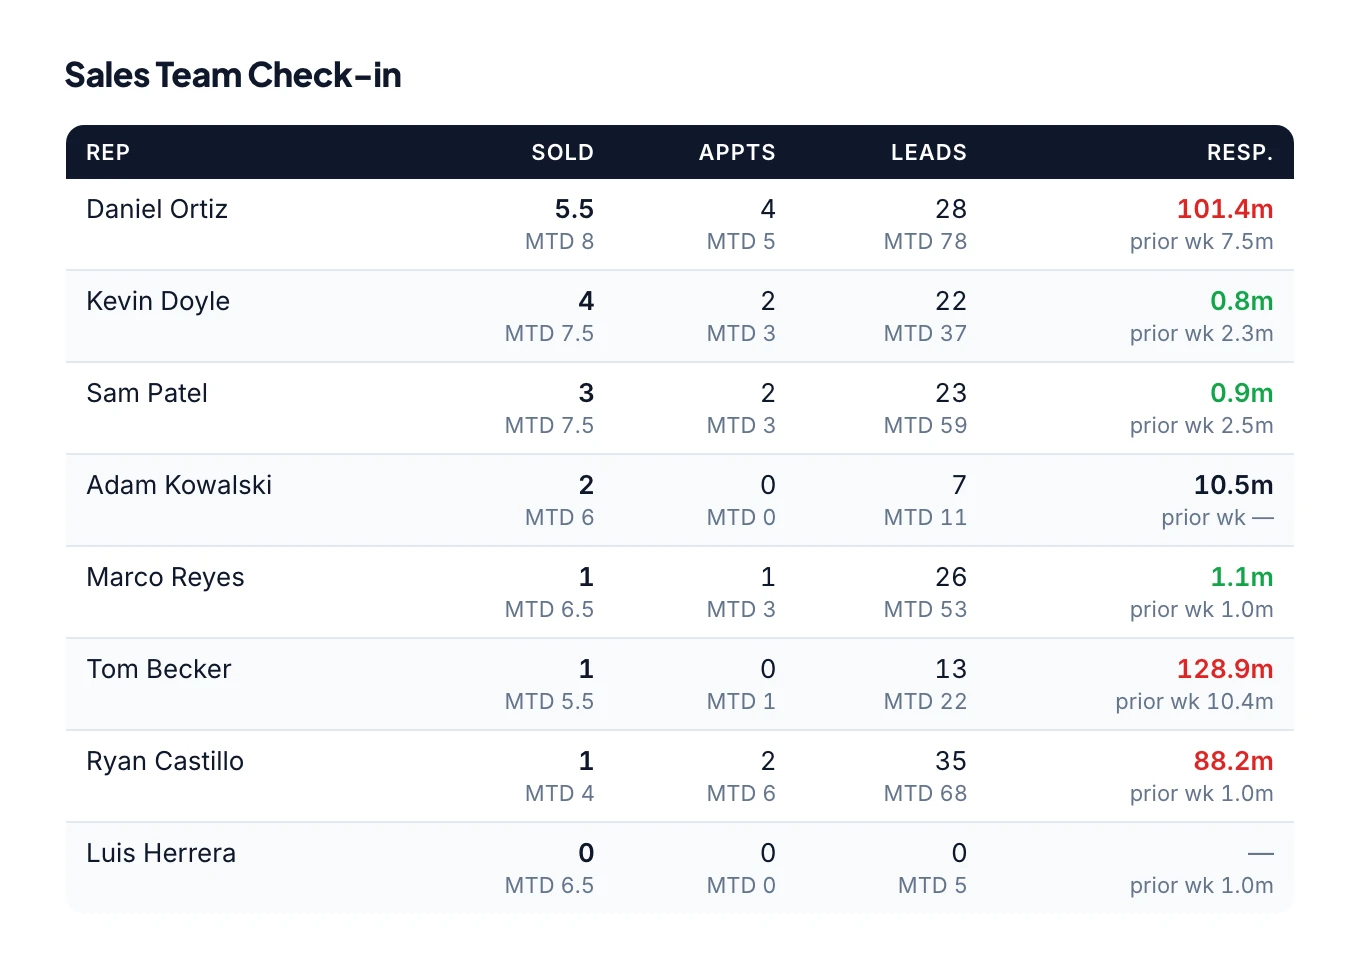
Every salesperson's units sold, appointments, leads and average response time for the week and month-to-date, sorted by results.
The month in review
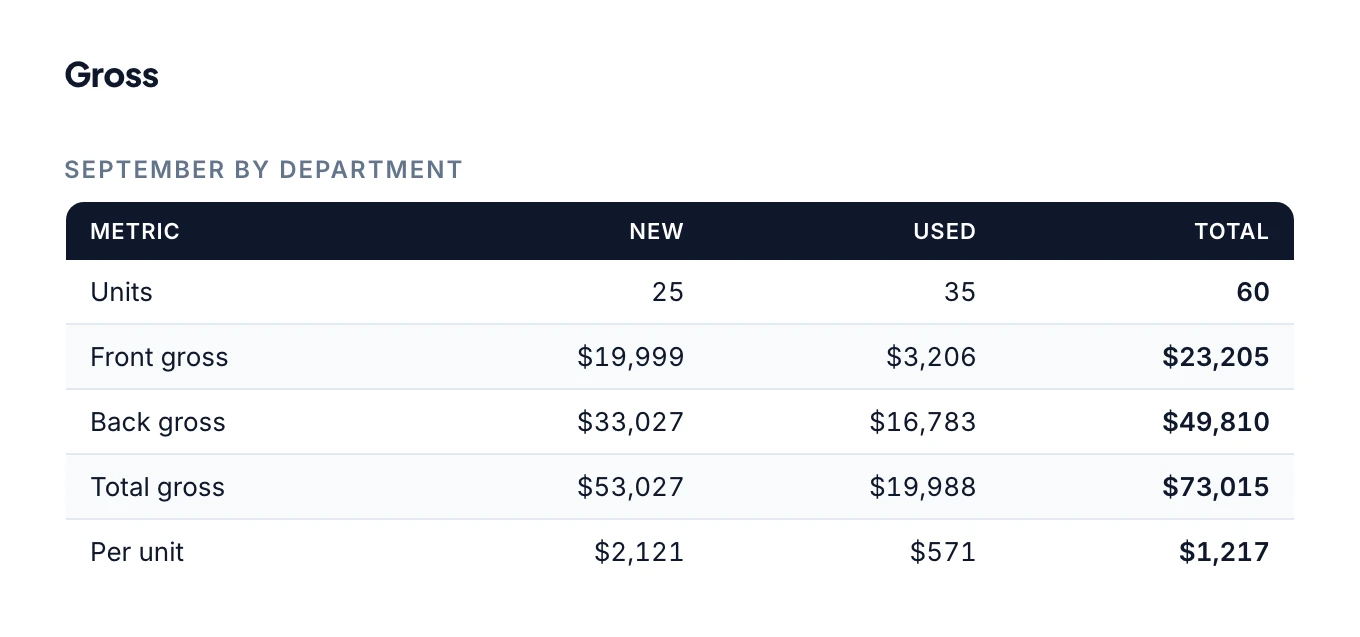
Every KPI for the month just closed, plus front, back and total gross by new and used, so you can see where the month's profit came from.
Ready to stop digging through reports?
Tell us about your dealership and we'll show you what MultiPointIQ can do for your store.